Linux 6.894757 kPa
Looking at the load.1/load.5/load.15 charts is a daily chore for all system admins. Trying to make sense of it is a whole different thing.

Linux Pressure Stall Information is a kernel feature identifying and quantifying the pressure on different hardware resources, making it easier for the human looking at the stats to make sense of the unrevealing load number.
It will show different stats for CPU, Memory and I/O starvation, enabling granular understanding of computer workload.
Making Sense of the Title
6.894757 kPa equals to 1 PSI, but I am European, and it is well known we can't comprehend Imperial units. This has absolutely nothing to do with Pressure Stall Information though.
The Load Average
CPU, RAM and I/O are essential for all systems` performance, and if any one of those is lacking for the workload a machine needs to handle, tasks will pile-up in queues, waiting for the lacking resource.
The usual way of assessing that is looking at the average load via uptime, top or something similar. Nothing wrong with that, but it doesn't tell us the nuances in why the system is under load, and what should we do to prevent it.
The average load includes all tasks in a TASK_RUNNABLE or TASK_UNINTERRUPTIBLE state, which is described as "task waiting for a resource". The actions from the system admin are clearly different in case we're lacking cpu vs memory or io. The avg load number, thus, is a count, which will be helpful for use in conjunction with the PSI stats, as we will see later.
Granularity is also pretty coarse, given that we have load averages within 1, 5 and 15 minute windows. If we have a latency sensitive task, it could be getting into issues much before it moves the needle on a 1 minute average.
In Comes the Saviour - PSI stats
The PSI stats will show a resource being waited on in averaging windows of 10, 60 and 300 seconds. If that isn't granular enough, there is also a total field which is an absolute stall time in microseconds, allowing for custom time averaging.
The stats are written to three files in /proc/pressure directory, named cpu, memory and io. Each of the files has two lines, starting with some and full. Some meaning that one or more tasks are delayed waiting for the resource, while full means none of the tasks are getting to use the resource in the percentage of time expressed.
CPU
The /proc/pressure/cpu file will show both some and full values.
Some means one or more tasks are waiting for the given percentage of time.
Full is there just to align the format with other two files, where this value makes more sense. In the case of cpu, it would mean we are constantly doing context switching, not doing anything useful, which shouldn't be possible.
Memory
Waiting on memory, usually means waiting on swap-ins, page cache refaults or page reclaims. Since we usually have a limited amount of memory available compared to the data set, we need to swap pages in and out of it. In that process some pages get from the inactive to the active list (a page fault would get the page loaded into memory, but stored in the inactive list, and a refault would move it to the active list so it would get reclaimed later rather than sooner.
Low numbers for the some stat could be acceptable, but a high value for the full stat means the tasks spend the time thrashing their own pages in memory (loading and reclaiming in a cycle, before any real work can be done), and we have created too much memory pressure for the system to work properly. This is something to be considered problematic, even with low numbers.
The important point is that although this stat is about memory contention, it means the cpu cycles are getting wasted, i.e. doing unproductive work.
I/O
The i/o file is similar to memory in concept, and it is reporting on all i/o caused delays.
Relativity is important
Let's say we have a single task running on the single cpu core we have, and no other tasks are waiting in the queue. PSI/cpu would be 0. If we add one more task, making the two take turns on the cpu, without waiting for a different resource, for simplification, we would have some PSI/cpu at a 100, meaning that one or more tasks are waiting for the cpu 100% of the time. If we have only two tasks, and the scheduler is built fairly, this will mean we have a perfect utilization of our CPU resource, given that no cycles are wasted.
This does take into account the number of cpus, so the PSI values are relative to the number of tasks actually running. If we had two tasks running on the two available cpu cores, and one task waiting, some PSI/cpu would be 50, as 50% of the number of tasks running are being held back in a queue. For the actual formulas used, you can have a look at the code in the kernel repo.
If this some/full logic is confusing, read this passage until it is clear:
To calculate wasted potential (pressure) with multiple processors, we have to base our calculation on the number of non-idle tasks in conjunction with the number of available CPUs, which is the number of potential execution threads. SOME becomes then the proportion of delayed tasks to possible threads, and FULL is the share of possible threads that are unproductive due to delays.
Real-world example
We can look at an example of an Elasticsearch cluster under load. Comparing the charts for average load and PSI stats, we can see how they can reveal different valuable information.
Load
Should the load shown below be considered problematic?
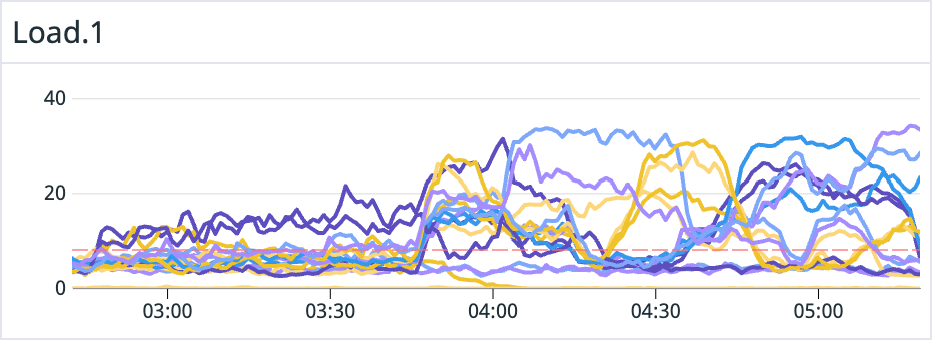
Given this chart, we could see that the system is under some load. But, to assess how much, and does it present a problem, we'd need to know the number of cpu cores on each instance in question, and, for memory or i/o driven load, we'd be in the blind. For reference, data bearing instances in question have 16 cores. In case we have different instances working together, (e.g. Elasticsearch has master nodes, usually set up with smaller instances), it wouldn't be easy to look at one chart and deduct the relative load level.
PSI
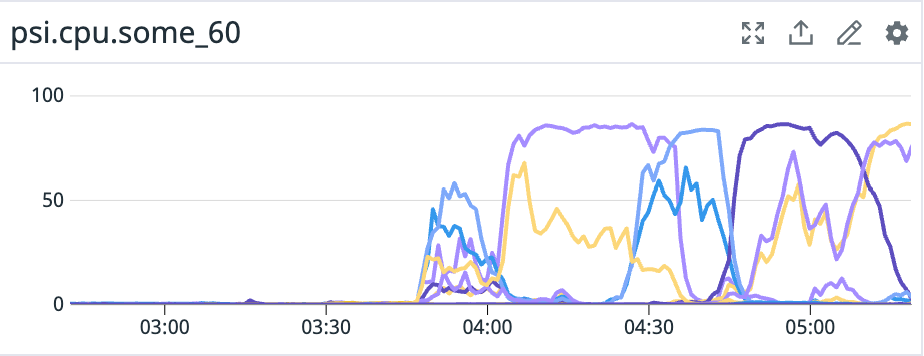
Here, CPU stats are showing some of the instances having tasks waiting on CPU near 100% of the time. This is clearly a potential issue, and it is easy to grasp on the relative starvation even with differently sized instances on one chart.
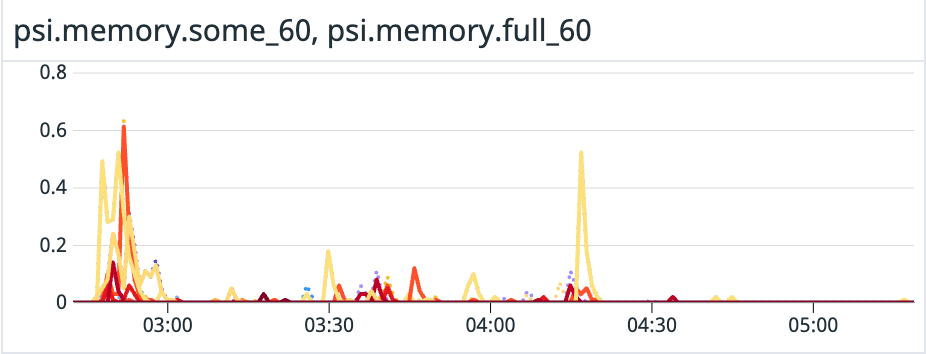
We can rule out memory pressure as a driver in this case, as under 0.5% of the time are tasks waiting on memory.
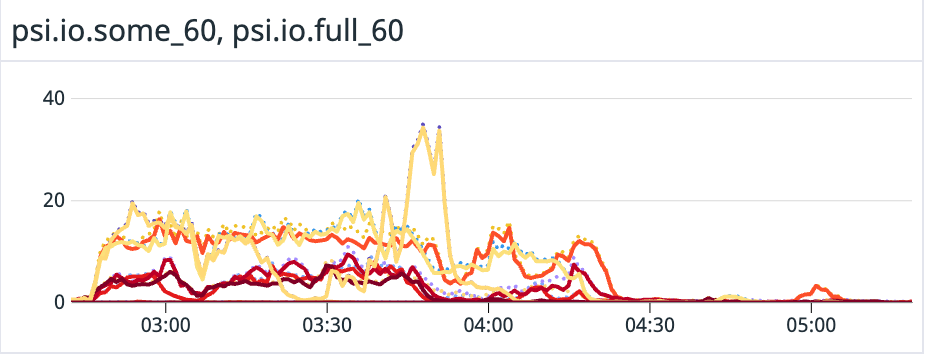
In this case, we can see i/o hold-up is not too high, under 20% of the time, except for one spike. It is the main driver of the load between 2:45 and 3:45 though. If it was higher, we should consider upgrading the i/o throughput somehow.
Looking at all three PSI charts, we can see that CPU has been the cause of starvation, and, looking at the load avg chart, we had roughly the same number of tasks waiting in the queue, as we had running on the 16 cpu cores of the most affected instances.
If we are noticing issues elsewhere in the system, we would need to scale up based on cpu cores. We could choose different types of instances, or just add more of them in case of Elasticsearch, which is able to scale up both horizontally and vertically.
Conclusion
If we know which resource we are lacking in, we could fine tune the set up, use different hardware, or deduct more precisely which part of our application (creating the queries) might be the load driver. Using PSI stats along with load avg gives us an excellent insight into the state of our system.
Dig Deeper
https://github.com/torvalds/linux/blob/v6.0/kernel/sched/psi.c
https://github.com/torvalds/linux/blob/master/mm/workingset.c
https://en.wikipedia.org/wiki/Thrashing_%28computer_science%29
https://biriukov.dev/docs/page-cache/0-linux-page-cache-for-sre/
https://lwn.net/Articles/759658/